Track your Google Play Books reading sessions and visualize progress, pace, and ETA with interactive charts.
Track your Google Play Books reading sessions and visualize progress, pace, and ETA — all in your browser.
![]()
Google Play Books shows you what page you're on. That's it. It doesn't tell you how fast you read, how long you spent in a book, when you'll finish, or how your reading volume looks day by day.
Playbook Analytics tracks every page change in the Play Books web reader and turns it into a per-book dashboard with the numbers that actually matter — pages per hour, time to finish, fastest session, daily reading volume, and a zoomable chart of every reading session.
All your reading data stays on your machine. It's stored via your userscript manager's built-in storage (GM_setValue) and is never transmitted, uploaded, or shared with any server. There are no analytics, no telemetry, no accounts, and no tracking pixels.
Just read. The script records each page change in the background. On each new book, it also auto-detects the total page count from the reader UI.
Click your userscript manager's toolbar icon while a Play Books reader tab is active. Under Playbook Analytics, choose 📊 Open Playbook Analytics. The dashboard opens in a new tab.
The dashboard URL (
https://example.com/playlytics) is a placeholder — the userscript intercepts the page before it loads anything fromexample.comand renders its own UI in its place. No data leaves your machine.
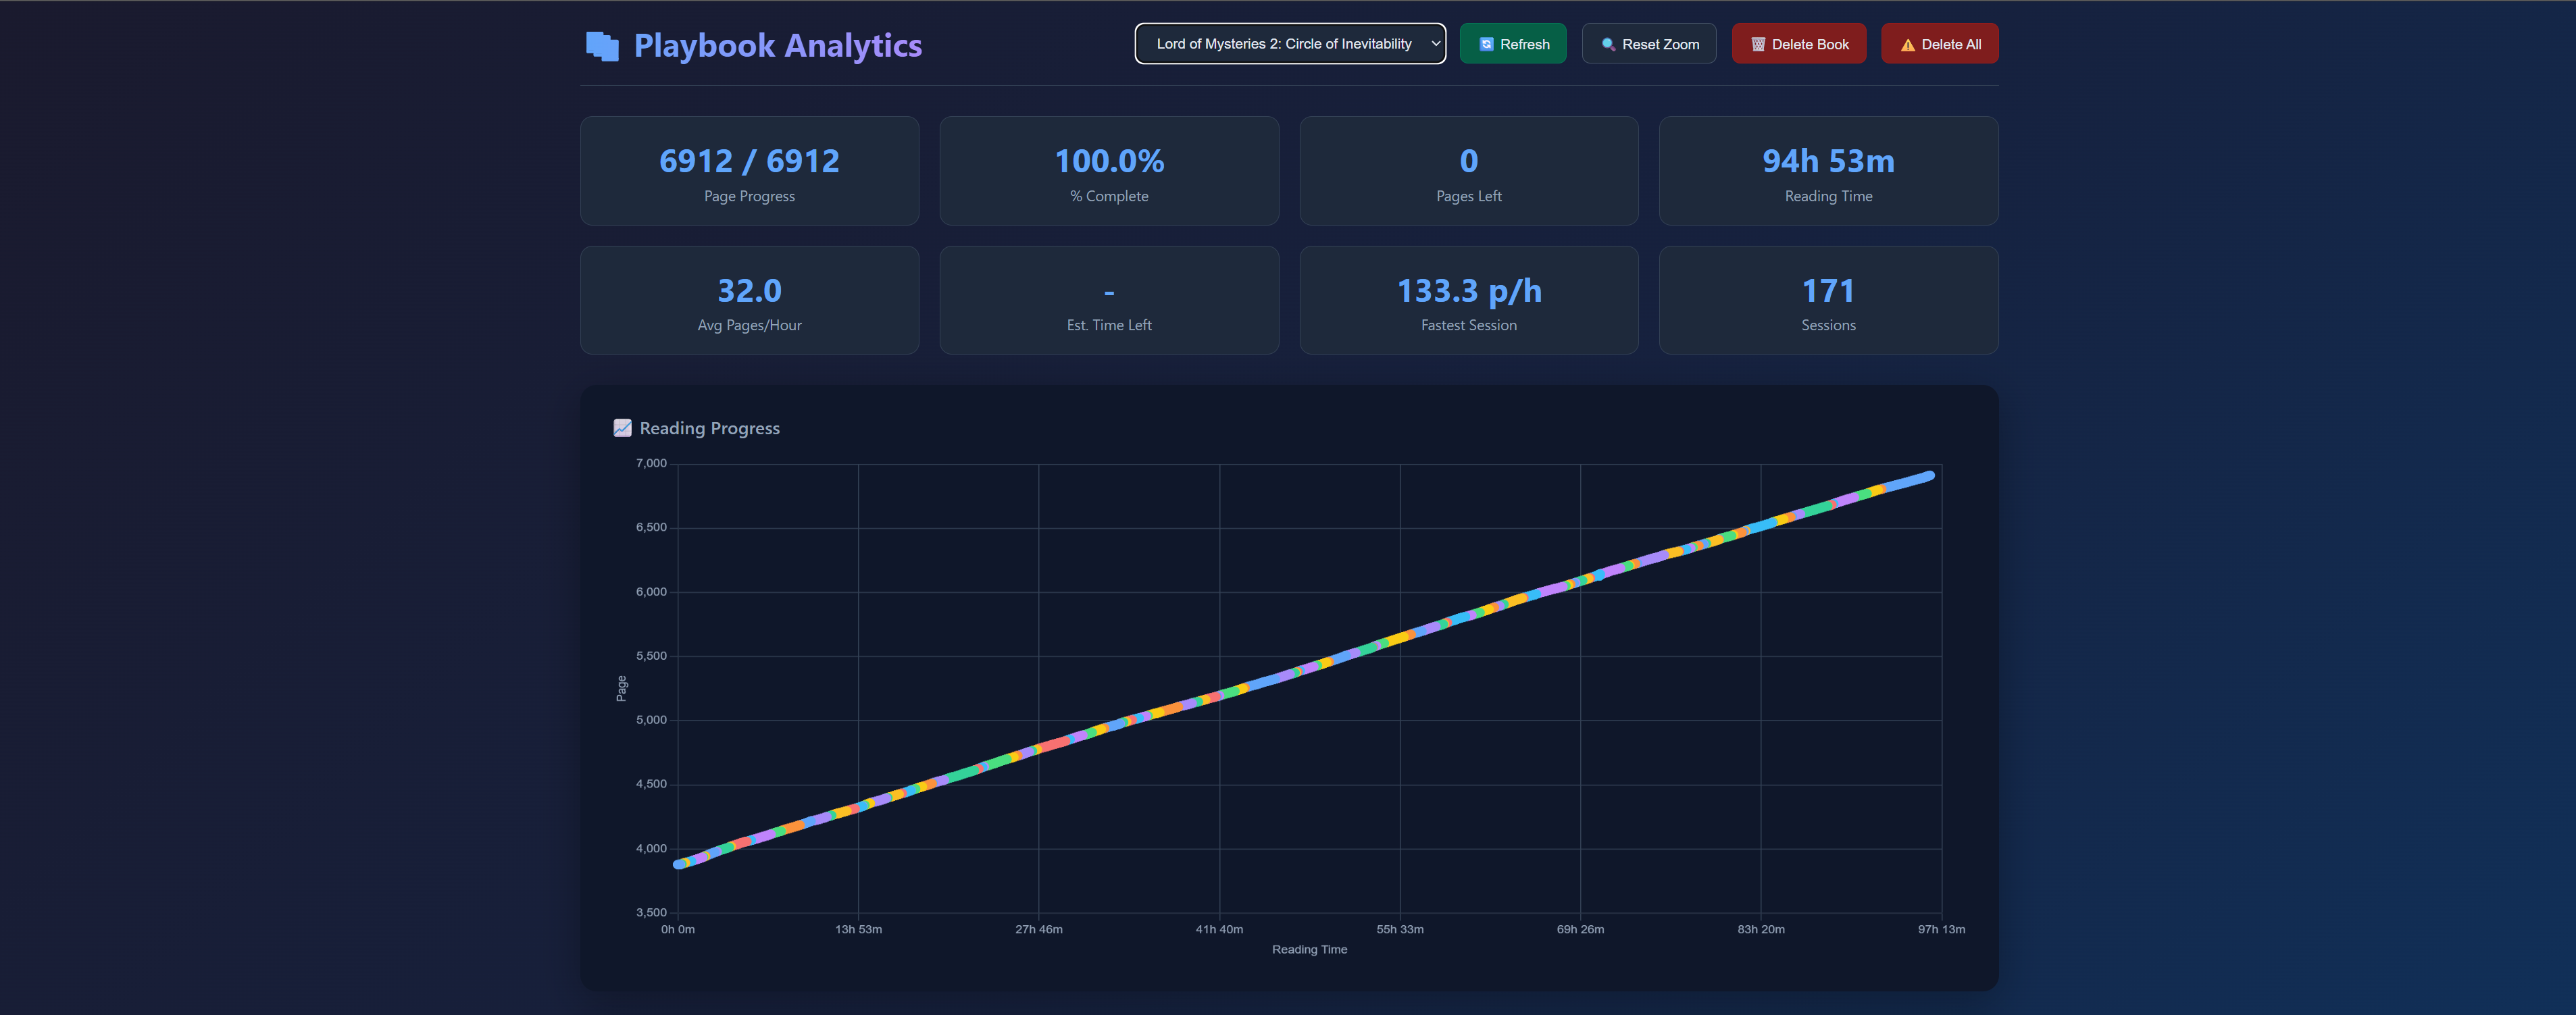
The top of the dashboard shows eight stat cards for the currently selected book:
| Stat | Meaning |
|---|---|
| Page Progress | Current page / total pages |
| % Complete | How far through the book you are |
| Pages Left | Pages remaining until the end |
| Reading Time | Total time spent actively reading |
| Avg Pages/Hour | Lifetime average reading speed for this book |
| Est. Time Left | ETA to finish, based on your average pace |
| Fastest Session | Your single fastest session's pace |
| Sessions | Number of distinct reading sessions |
Below them, the Reading Progress chart plots page number against active reading time, with each session in its own color and a small visual gap between sessions. Scroll to zoom, drag to pan, and hover any point for a tooltip showing the exact time, your % complete, how long you spent on that page, and the session's pace.
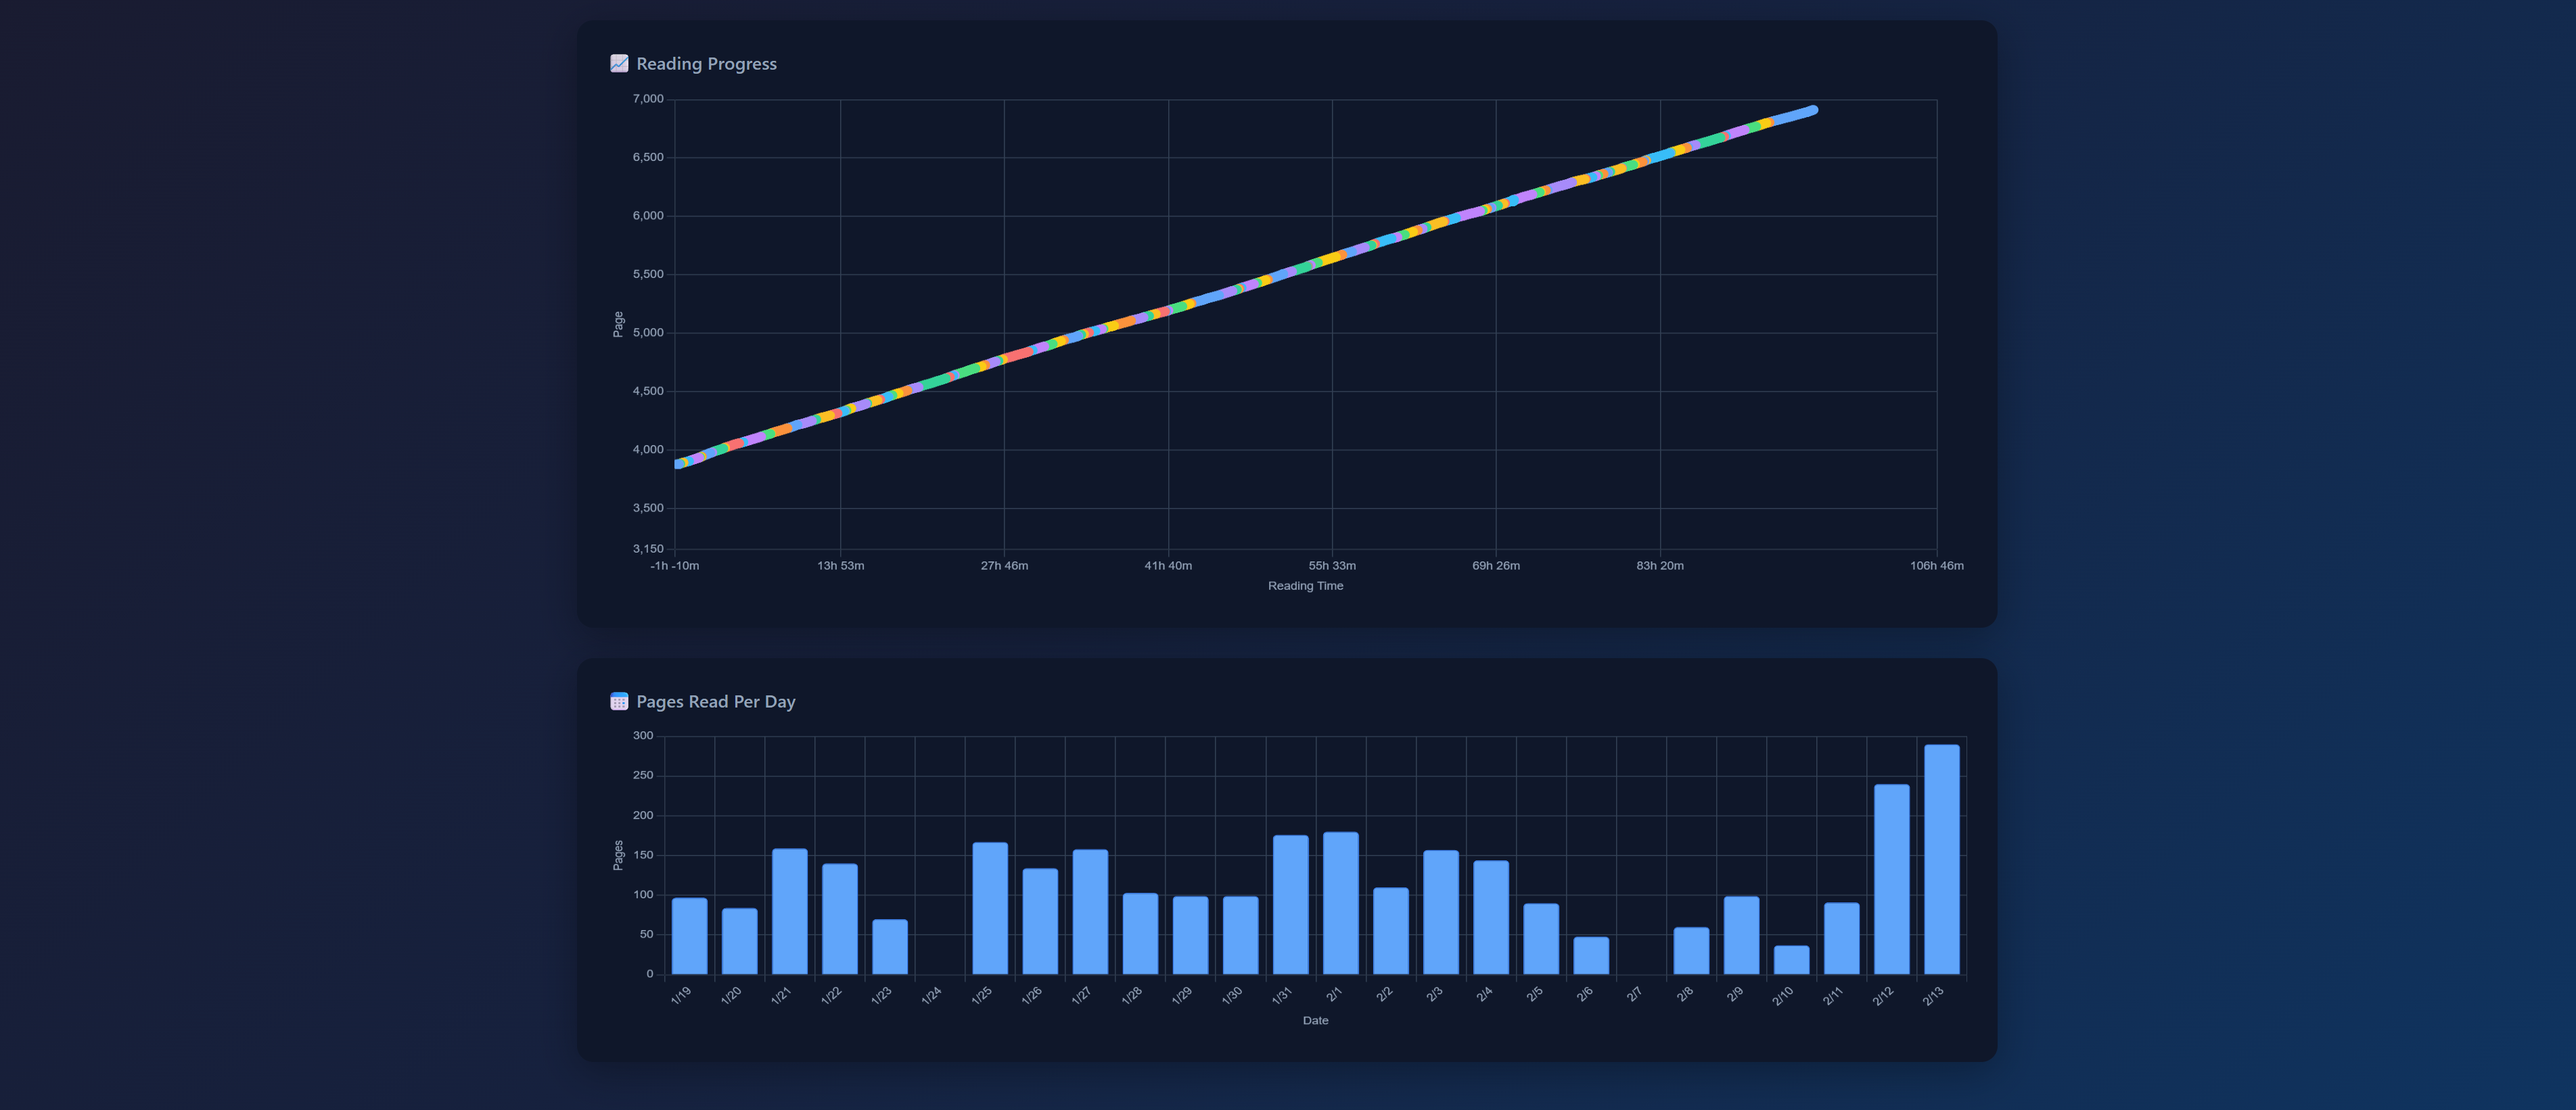
Underneath, the Pages Read Per Day chart shows your daily reading volume. Empty days are still drawn (in gray) so streaks and breaks are easy to see.
| Button | What it does |
|---|---|
| Book selector | Switch between any tracked book |
| 🔄 Refresh | Reload data from storage (picks up new books and new pages without a full page reload) |
| 🔍 Reset Zoom | Reset the reading-progress chart back to its full view |
| 🗑️ Delete Book | Permanently delete data for the currently selected book |
| ⚠️ Delete All | Permanently delete data for all books |
While a Play Books reader tab is active, your userscript manager's menu (under Playbook Analytics) gives you three commands:
play.google.com/books/reader). It does not work in the Android or iOS apps.MIT © Brandon Hall
