Statistics tracker
About
This is a script meant to track user's statistics for Archive of Our Own (aka AO3). It can track the total statistics and stats for individual works. The tracked data is stored in the browser's local storage and displayed using Chart.js.
The functionality is added through buttons on the bottom of the "totals" statistics group on the user's statistics page. The buttons are styled to match the applied site skin, but might not have perfect coverage of all possibilities.
Note: When changing between views (all years/specific year, fandom view/flat view, etc.) it might take the script some time to reapply.
Note: The script does not distinguish between stats across all years and those for a specific year. Mixing these is misuse of the script and users will have to manually remove "invalid" records from the local storage (the stats are technically valid, but the chart will be inaccurate).
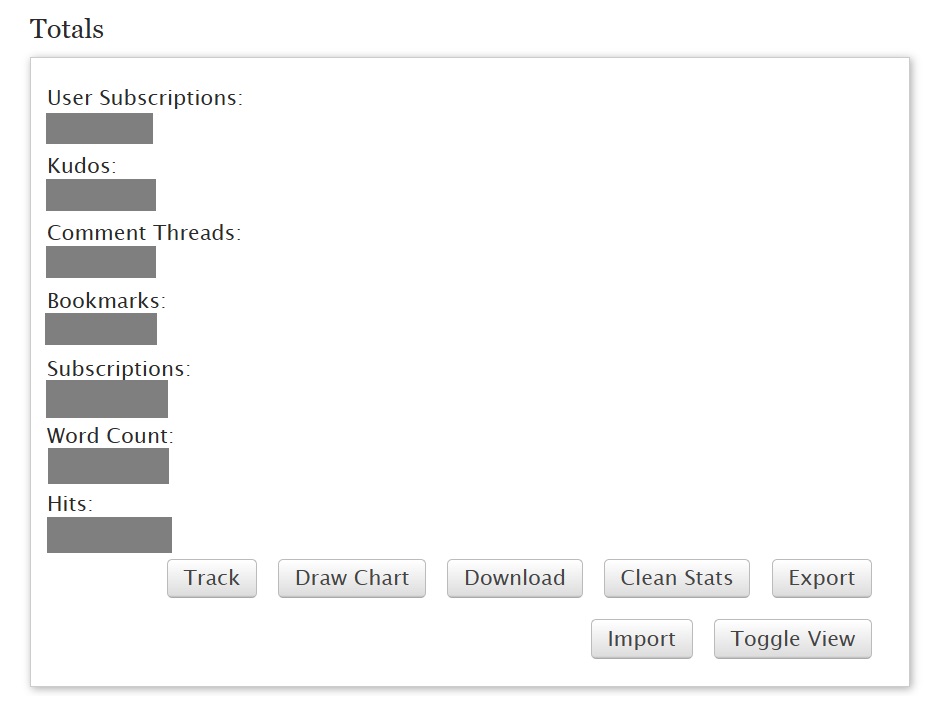
Action buttons with default skin (real statistics redacted).
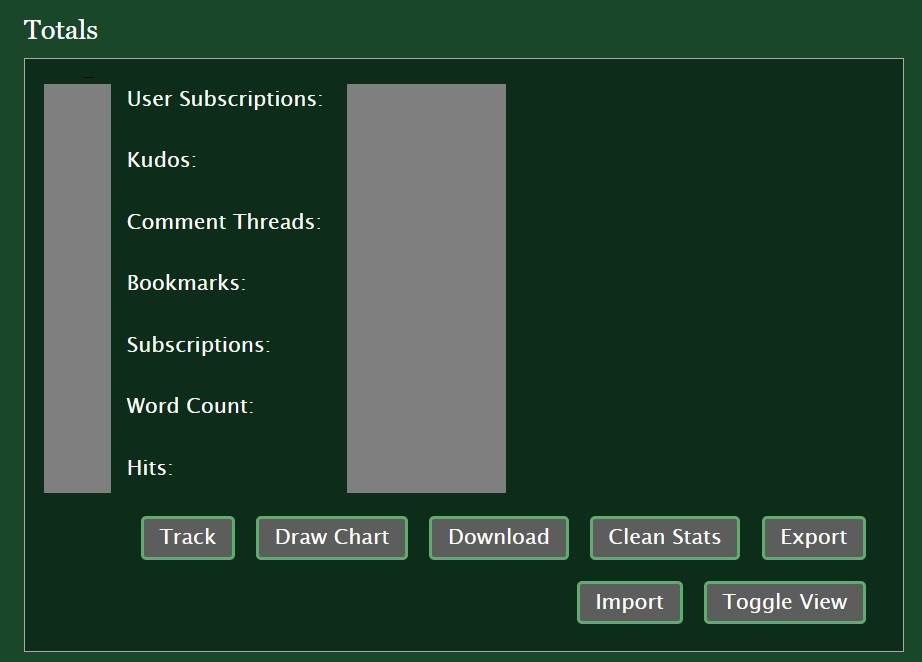
Action buttons with custom site skin (real statistics redacted).
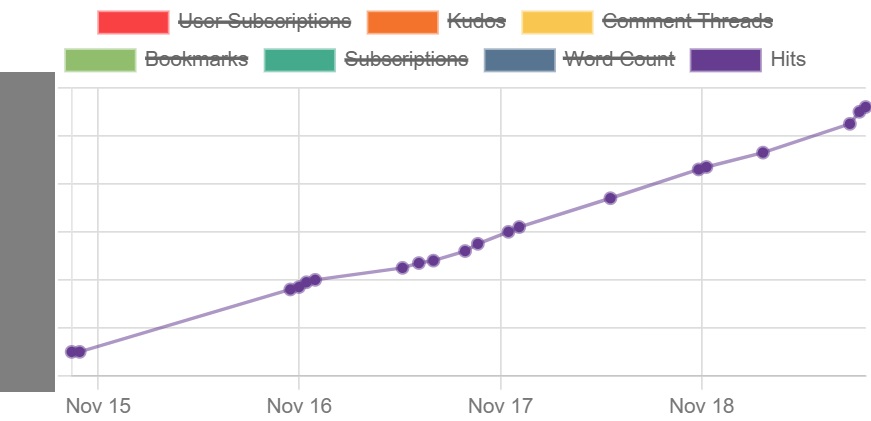
Statistics chart (real statistics on y-axis redacted), displaying hits.
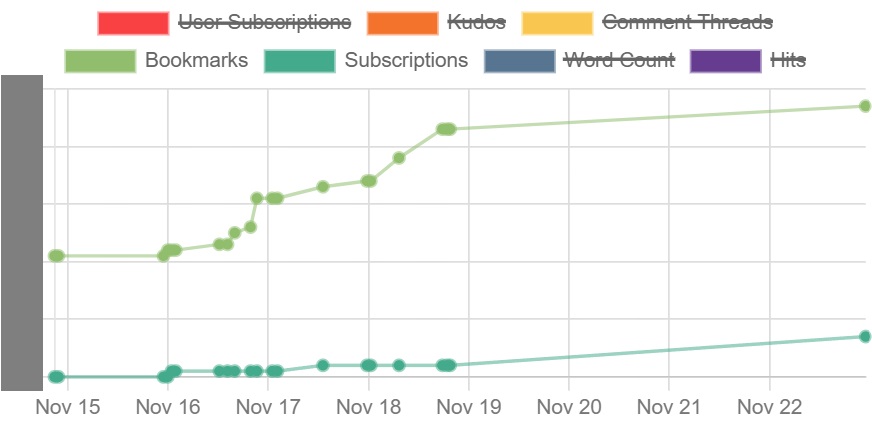
Statistics chart (real statistics on y-axis redacted), displaying bookmarks and subscriptions.
Functionality
Track Stats
Stores the total stats (always) and the work stats (if the INCLUDE_WORKS flag is set to true). Uses the browser's local storage. Most modern browsers can store up to 5 MiB of data in local storage, but be aware of the limitations. Use the export/import functionality to create and store backups securely.
Users with many works (in the hundreds) might want to consider setting the INCLUDE_WORKS flag to false, to avoid storing too much data. If someone experiences that the statistics are not being updated despite clicking the button to track them, check that the local storage is not full. If the storage is full, export the stats and start anew.
Draw Chart and Toggle View
Draws a chart of the statistics. The chart for "total" statistics is drawn by default. Each work also has a button to draw a chart for that work. Each chart has the option to toggle view (hide/show chart) with a small animation.
By setting the THEME_MODE flag, users can decide what color theme they want on the chart (light or dark mode). The chart shows the "hits" statistics by default, as this is usually the most frequently updated stat. All statistics types are drawn in the same chart and they may have widely different values. It is therefore recommended to only show stats in close ranges at the same time. Chart.js has the in-built function to toggle options on/off.
Change the values returned from the getTheme function to customize the colors beyond theme mode.
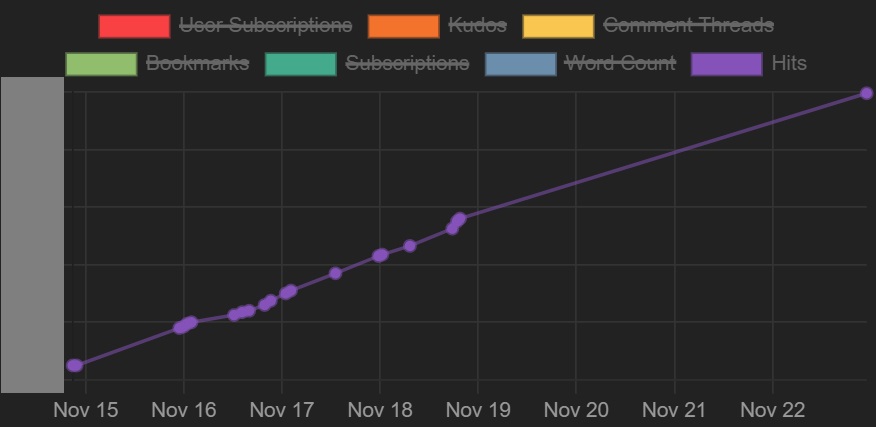
Statistics chart (real statistics on y-axis redacted), displaying hits (dark mode).
Download
Download a PNG image of the chart, as displayed in the browser.
Clean Stats
Users might want to track statistics frequently to make sure the statistics are as accurate as possible for their purposes, but they might not want to keep all the points since that clutters the storage with unnecessarily many data points. Cleaning the stats removes "unnecessary" points. A data point is deemed unnecessary if it is less recent than another data point within a time range.
Use the CLEAN_DATA flag to decide the time range. Options are "hour", "day" and "month".
For example, a user has set CLEAN_DATA to "hour". The user has the data points for a day at 09:01, 09:46, 09:58, 10:13, 10:39, 14:28, and 14:30. Only the data points at 09:58, 10:39 and 14:30 are kept, since they are the most recent within that hour.
Export and Import
The data stored in local storage can be exported into a CSV file. CSV files of valid format can also be imported and stored.
Set a custom DELIMITER flag if the default one clashes with a work name. The delimiter should be a character or string that is not included in any statistics name or work name.
Tips: Exported files can be used as backups, can be used to make custom charts in external software, and can be spliced together to make a larger record of stats. Imported files can be made manually by a user. If the user has estimations or records of stats from elsewhere that they want to include in the chart, they can make their own CSV file. Export a file to look at the correct formatting and replicate it.
Script dependencies
Chart.js v4.4.6
Chart.js adapter date-fns v3.0.0


