Display a graph of how often new chapters of a work are published. Accessible from the chapter index page or a work blurb
This is a script meant to display a work's chapter update frequency in a line diagram for works on
Archive of Our Own (aka AO3). The diagram is displayed using Chart.js. Automatically display the graph on the "Chapter Index" page, or manually display the graph in the work blurb.
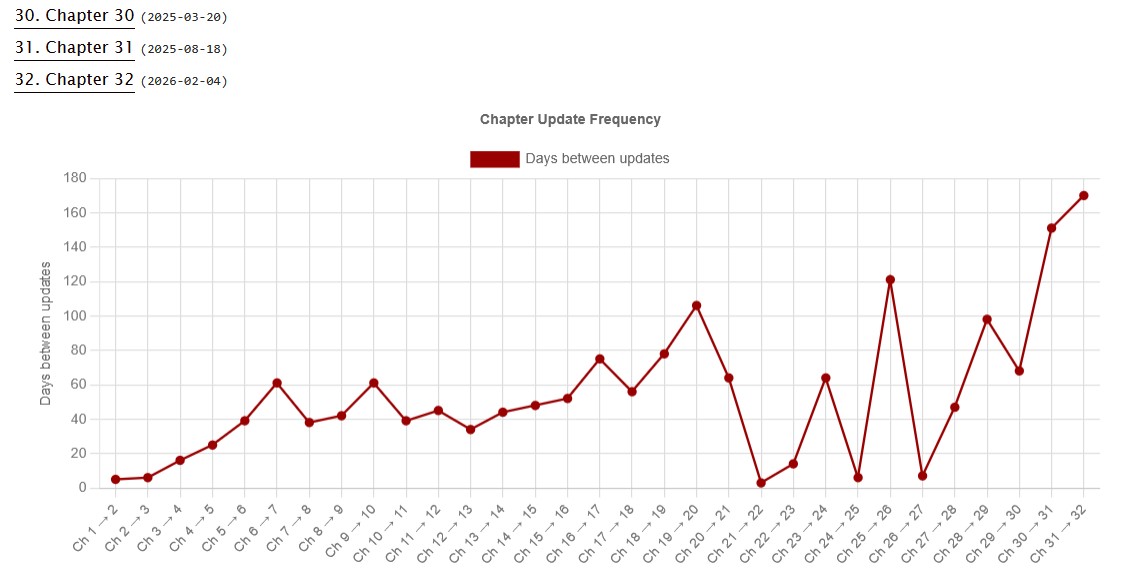
"Chapter Update Frequency" diagram on the "Chapter Index" page (Light Mode)
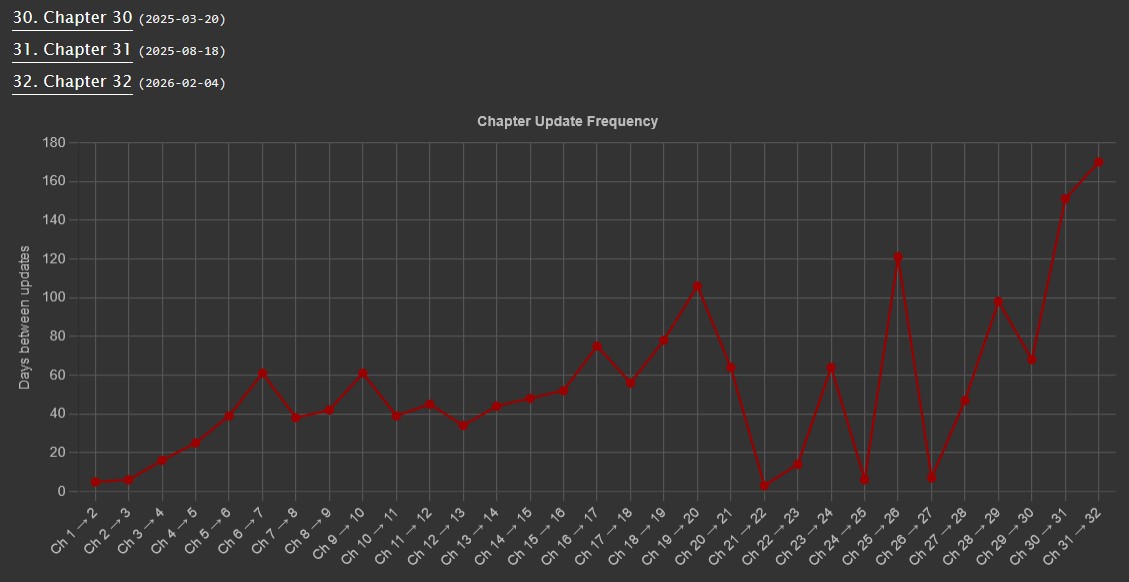
"Chapter Update Frequency" diagram on the "Chapter Index" page (Dark Mode)
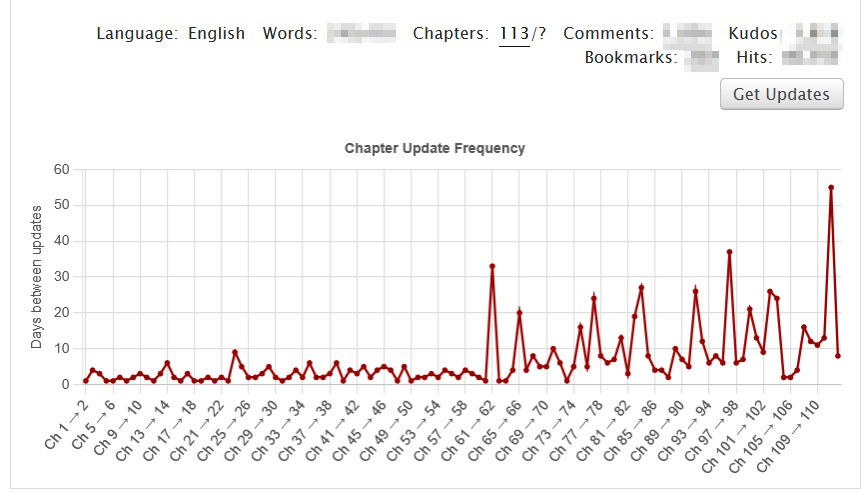
"Get Updates" button and "Chapter Update Frequency" diagram in the bottom of a work blurb
The script looks at the "Chapter Index" page, which contains a date for when each chapter was posted. (The page can be found by clicking on the "Chapter Index" button at the top of a work, and then going to the "Full-Page Index".) It calculates how many days have passed between each new chapter. (Only dates are included, so the assumed time becomes midnight UTC.)
On the "Chapter Index" page the diagram is automatically drawn. On pages with work blurbs, click on the "Get Updates" button to fetch the data and draw the diagram.
Not applicable for works with only one chapter.
Note: Creators can choose to set the publishing date of chapters manually. This could be used to backdate them if the work was cross-posted, or to set a new publishing date if a chapter got reworked. This can cause odd or inaccurate numbers to appear.
There is a light mode and dark mode theme, which is selected based on the theme in the browser. Edit the hex codes returned from the getTheme() function to customize the colours.
